.png)
Events Log
This screen displays information about the event logs in PEM. To access this tab, go to Events > Log in PEM. The Events panel allows administrators to define filtering criteria that regulates which events are shown in the Event Logs panel.
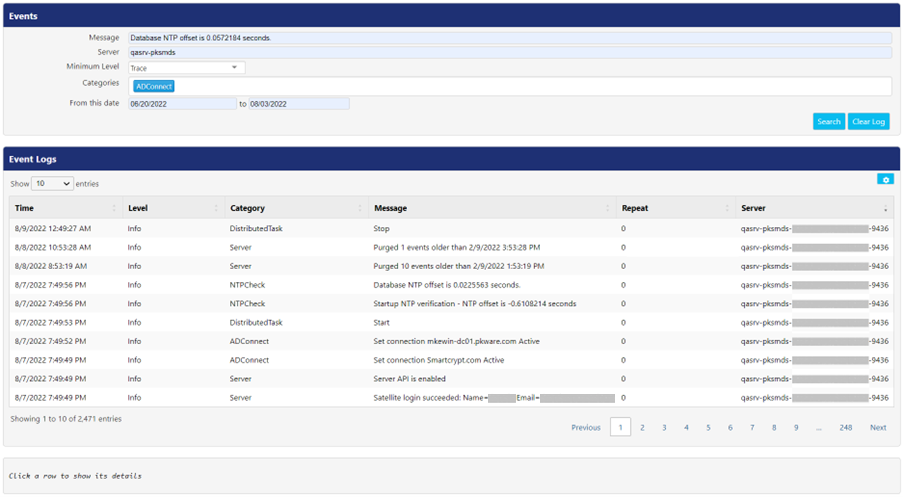
To filter the results shown in Event Logs panel, admins can select from the following criteria:
- Enter the text in Message and Server fields to search for certain terms in the event details.
- Select the level of severity from Minimum Level drop-down.
- Critical
- Error
- Warning
- Info
- Debug
- Trace
- Select the category of event types from Categories.
- Active Directory
- ADConnect
- BacklogQueue
- DistributedTask
- EmailSender
- LockerMessage
- Metaclient
- MFAAdapter
- NTPCheck
- Server
- Select date from the calendar that appears on clicking From this date and to textboxes.
- Click Search button to populate the Event Logs panel, based on the selected filters.
- Click Clear Log button to clear all the logs visible in Event Logs.
Following is the description for the columns.
Column | Description |
Time | This field displays the timestamp of event log generation. |
Level | This field displays the level of severity for each The PEM determines the severity level for all events. |
Category | This field displays the category for each event that occurred in the PEM. |
Message | This field displays any message associated with the event. |
Repeat | This field displays the number of times a particular event has occurred. Once it reaches this limit, these events are suppressed and not further shown in panel. |
Server | This field displays server configuration of PEM. |
Click 
- Clipboard: Click this button to copy all the rows visible on the panel to the default clipboard. Press CTRL+V on any Microsoft Application to paste the copied text data there.
- CSV: Click this button to download the data, visible on the panel in csv format.
- Excel: Click the button to download the data, visible on the panel in excel format.