.png)
Events
Events tab stores all the logs generated by the PK Endpoint Manager (PEM) that includes errors, clustering updates, and administrative actions on policies. Administrators can use the filters to search for specific events and select where the events should be stored.
Event Logs
This screen displays information about the event logs in PEM. To access this tab, go to Events > Log in PEM. The Events panel allows administrators to define filtering criteria that regulates which events are shown in the Event Logs panel.
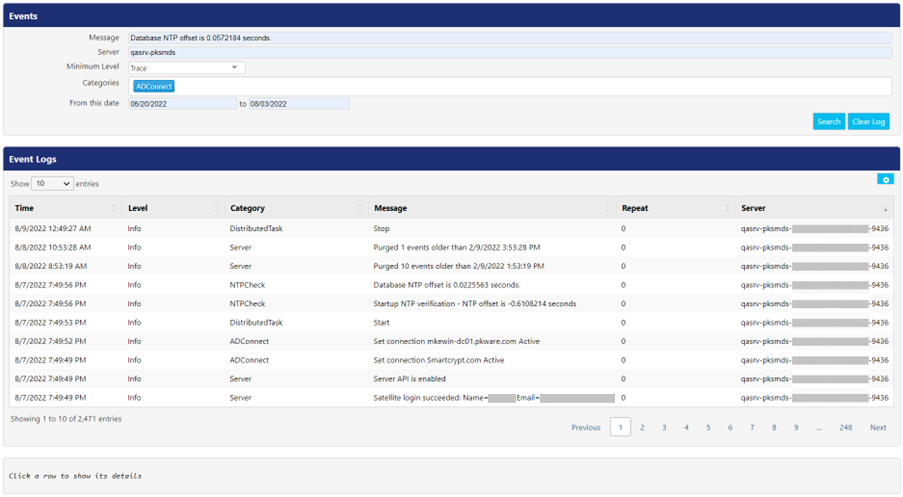
To filter the results shown in Event Logs panel, admins can select from the following criteria:
- Enter the text in Message and Server fields to search for certain terms in the event details.
- Select the level of severity from Minimum Level drop-down.
- Critical
- Error
- Warning
- Info
- Debug
- Trace
- Select the category of event types from Categories.
- Active Directory
- ADConnect
- BacklogQueue
- DistributedTask
- EmailSender
- LockerMessage
- Metaclient
- MFAAdapter
- NTPCheck
- Server
- Select date from the calendar that appears on clicking From this date and to textboxes.
- Click Search button to populate the Event Logs panel, based on the selected filters.
- Click Clear Log button to clear all the logs visible in Event Logs.
Following is the description for the columns.
Column | Description |
Time | This field displays the timestamp of event log generation. |
Level | This field displays the level of severity for each The PEM determines the severity level for all events. |
Category | This field displays the category for each event that occurred in the PEM. |
Message | This field displays any message associated with the event. |
Repeat | This field displays the number of times a particular event has occurred. Once it reaches this limit, these events are suppressed and not further shown in panel. |
Server | This field displays server configuration of PEM. |
Click 
- Clipboard: Click this button to copy all the rows visible on the panel to the default clipboard. Press CTRL+V on any Microsoft Application to paste the copied text data there.
- CSV: Click this button to download the data, visible on the panel in csv format.
- Excel: Click the button to download the data, visible on the panel in excel format.
Config
Use the Event Forwarding screen under this tab to configure the settings for events. To access this screen, go to Events > Config in PEM. Click Edit to create or select the location for storing events.

Following is the explanation of fields on this screen.
Field | Description |
Target | This field displays the location of the server that stores all events generated by PEM. |
Target Type | Select the target type from the drop-down. It consists of seven options as below: · None (default) · Elastic Search · Splunk HTTP(S) with JSON · Syslog TCP RFC-3164 · Syslog TCP RFC-3164 with JSON · Syslog TCP RFC-6587 · Syslog TCP RFC-6587 with JSON Note: On selecting None, the event logs get stored in PEM's internal elastic search. |
URL | Enter the URL of the server chosen in Target Type drop-down. This field does not appear when None is opted as target type. |
Index | Enter the index name to be used for Elastic Search. This field is visible when Elastic Search is chosen as target type. |
Token | Enter the token provided from Splunk server. This field is visible when Splunk is chosen as target type. |