.png)
Dashboards
The PEM Administrator Dashboard allows admins to quickly review the important data that has been processed. Using this screen, admins can analyse data displayed in a combination of f graphs and charts . PEM offers default set of panels on this page, but administrators can add, remove, or modify the individual charts that comprise a Dashboard to show the present the information in a way that’s meaningful to them.
To enable Dashboards, you must configure the following
- Enable Daily Reports, from the Advanced > Reports, page.
- From the Reporting > Config page, ensure that the 'Target Type’ in the “'Edit Data Security Intelligence Policy’' section is set to ‘elastic search’.
- From the Dashboard > Config page, ensure that the ‘'Target’ is set to ‘same as DSI target’.
By default, the following panels are displayed:
- Servers Created / Protected Servers
- Endpoints Created / Protected Endpoints
- VDIs Created / Protected VDIs
- Accounts Created / Protected Accounts
- Encryptions / Decryptions
- Discoveries: By Pattern, By User, By Location
- Discovery Remediation By Action
Dashboard Controls
The controls specified in this screen allows a user to add, edit, refresh, lock or unlock dashboard, etc. The data on the dashboard can be filtered based on the date range. Following are the controls:
Options | Description |
All | This shows all data, that has been compiled since the system was configured to produce dashboard reports. |
Absolute | This allows admins to configure an absolute time/ date range that will apply to the data in the charts. E.g., if you want to filter data for month of August 2022, then specify starting range from 1/08/2022 to 31/08/2022. |
Relative | This allows admins to configure a relative time / date range, that will apply to the data in the charts. E.g., if you want to filter data for the last 3 months, you can configure this date value from the drop-down fields. |
Add Panels
Click 
- Archive
- Redaction
- Discovery
- General
- Classification
- System
- Double Key Encryption (DKE)
- Utility
Refresh Panel Data
Click Refresh 
Select a Specialized Dashboards
If you want to focus on specific areas of PK Protect processes, click Select Dashboard 
Dashboard Type | Description |
Classification Dashboard | The Classification dashboard provides an overview of how PKWARE is protecting files in the environment by applying classification labels. |
Double Key Encryption (DKE) Dashboard | The Double Key Encryption (DKE) dashboard provides an overview of how PKWARE is identifying and protecting sensitive information via double key encryption. |
Email Dashboard | The Secure Email dashboard provides an overview of how PKWARE is identifying, and protecting sensitive information in email messages and attachments. |
Encryption Dashboard | The Encryption dashboard provides an overview of how PKWARE is encrypting and decrypting data in the environment. |
MIP Dashboard | The MIP dashboard provides an overview of how PKWARE is protecting files in the environment by applying MIP labels. |
Redaction Dashboard | The Redaction dashboard provides an overview of how PKWARE is identifying and protecting sensitive information in the environment using data redaction. |
System Dashboard | The System dashboard provides an overview of system information, the number of active users and devices, as well as the different agent versions deployed in the environment. |
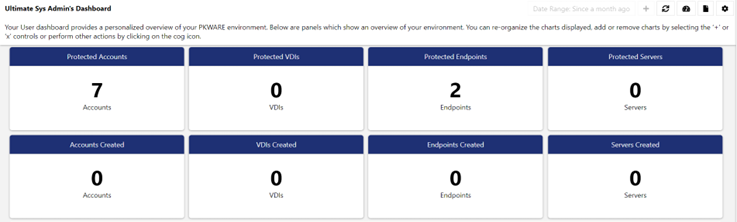
Ultimate Sys Admin Dashboard | This dashboard provides a personalized overview of your PKWARE environment. This panel will include all the default panels. |
Export Panels
You can download the dashboard reports in PNG or CSV format. To do so, click 
Settings
The options listed in Setting allow you to add, edit, hide, delete, etc., the dashboards.
Options | Description |
Hide Description | This option allows you to hide description displayed at the top of the screen for the selected panel. |
Show Description | This option allows you to unhide description displayed at the top of the screen for the selected panel. |
New Dashboard | This option allows you to create a custom dashboard. |
Edit Dashboard | This option allows you to edit the description displayed at top of the screen. |
Unlock Dashboard | This option allows you to unlock the dashboard to edit the description or to add charts and graphs. |
Lock Dashboard | This option allows you to lock the dashboard to restrict the editing feature. |
Delete Dashboard | This option will delete the dashboard by removing all panels and description. |
Restore Dashboard | This option will restore the dashboard to its default state removing any customizations that were made. |
Restore Defaults | This option will restore the dashboard page to its default state, any new or custom dashboards will be removed. |
Add Filters to Existing Charts
You can add filters to existing charts by selecting criteria in the Filters section of the properties dialog. Once filters are defined, click Save to Dashboard to apply the filters, and the data in the existing chart is modified based on the criteria entered. You can access the properties dialog by selecting the 
Option | Description |
AD User (Active Directory) | Select an AD User from the drop-down and input the email address in the provided field. For example, administrator@pkware.com |
User Email | Select User Email from the drop-down and input the specific user's email ID in the provided field. For example, john.lenin@pkware.com |
File | Select File from the drop-down and input the name of a file in the provided field. |
Location | Select Location from the drop-down and input the folder path in the provided field. |
Action | Select Action from the drop-down and input the specific Remediation Action you would like to search for in the provided field. The available options are: Report - Files that triggered an action of Report based on the discovery of sensitive information. Decrypt - Files on which decrypt action was taken. MIP - Files on which Microsoft Information Protection (MIP) labels have been applied. Encrypt - Files on which an encrypt action was taken. Classify - Files on which PKWARE classification labels have been applied. Redact - Files on which redact action was taken. Delete - Files on which delete action was taken. Note: To learn more about each Remediation Action, visit Remediation. |
Pattern | Select Pattern from the drop-down and input the specific pattern name in the provided field. For example, Email Address, Credit Card Numbers, Social Security Number, etc. |
Definitions
Chart Name | Default Dashboard Location | Chart Information |
|---|---|---|
Encryptions | Ultimate Sys Admin's Dashboard | The number of encryption actions executed. Showing the total for each day, for the time range of the report |
Encryptions by Location | Encryption Dashboard | Encrypted files that contain the most sensitive items in them, with a slice showing the total number of sensitive items in each file (Top 10 files with most sensitive items) |
Encryptions by User | Encryption Dashboard | The number of encryption actions executed, with a slice showing the total for each unique user (Top 10 users based on number of encryption events) |
Decryptions | Ultimate Sys Admin's Dashboard | The number of decryption actions executed. Showing the total for each day, for the time range of the report |
Decryptions by Location | Encryption Dashboard | Decrypted files that contain the most sensitive items in them, with a slice showing the total number of sensitive items in each file (Top 10 files with most sensitive items) |
Decryptions by User | Encryption Dashboard | The number of decryption actions executed, with a slice showing the total for each unique user (Top 10 users based on number of decryption events) |
Redacted Files | Redaction Dashboard | The number of files that were redacted. Showing the total for each day, for the time range of the report |
Redacted Emails | Redaction Dashboard | The number of emails that were redacted. Showing the total for each day, for the time range of the report |
Redacted Files by Pattern | Redaction Dashboard | The number of redacted files, with a slice showing the number for each discovery pattern that triggered the redaction (Top 10 patterns) |
Redacted Files by Location | Redaction Dashboard | Redacted files that contain the most sensitive items in them, with a slice showing the total number of sensitive items in each file (Top 10 files with most sensitive items) |
Redacted Files by User | Redaction Dashboard | The number of redacted files, with a slice showing the total for each unique user (Top 10 users based on number of redaction events) |
Redacted Items by Content Type | Redaction Dashboard | The number of items that were redacted, with a slice showing each type of content. For example: ‘Email Message Body’, ‘Email Subject’, ‘Email Attachment’ or a ‘File’ (Top 10 types) |
Emails with Redacted Subjects by Pattern | Redaction Dashboard | The number of emails whose subject was found to contain sensitive information and was redacted. With a slice showing each discovery pattern triggered. (Top 10 patterns based on the number of emails redacted) |
Emails with Redacted Message Bodies by Pattern | Redaction Dashboard | The number of emails whose message body was found to contain sensitive information and was redacted. With a slice showing each discovery pattern triggered. (Top 10 patterns based on the number of emails redacted) |
Emails with Redacted Attachments by Pattern | Redaction Dashboard | The number of emails whose attachment(s) was found to contain sensitive information and was redacted. With a slice showing each discovery pattern triggered. (Top 10 patterns based on the number of emails redacted) |
Emails with Redacted Subjects by User | Redaction Dashboard | The number of emails whose subject was found to contain sensitive information and was redacted. With a slice showing the total for each unique user. (Top 10 users based on number of emails) |
Emails with Redacted Message Bodies by User | Redaction Dashboard | The number of emails whose message body was found to contain sensitive information and was redacted. With a slice showing the total for each unique user. (Top 10 users based on number of emails) |
Emails with Redacted Attachments by User | Redaction Dashboard | The number of emails whose attachment(s) was found to contain sensitive information and was redacted. With a slice showing the total for each unique user. (Top 10 users based on number of emails) |
Discoveries | Ultimate Sys Admin's Dashboard | The number of discovery actions executed. Showing the total for each day; for the time range of the report |
Discoveries by User | Ultimate Sys Admin's Dashboard | The number of discovery actions executed, with a slice showing the total for each unique user. (Top 10 users based on number of discovery events) |
Discoveries by Location | Ultimate Sys Admin's Dashboard | Discover events on files that contain the most sensitive items in them, with a slice showing the total number of sensitive items in each file (Top 10 files with most sensitive items) |
Discoveries by Pattern | Ultimate Sys Admin's Dashboard | The number of discovery events executed, with a slice showing the number for each discovery pattern (Top 10 patterns based on number of discovery events) |
Discovery Remediations by Action | Ultimate Sys Admin's Dashboard | The number of remediation actions taken, with a slice showing the number each unique remediation type. (Top 10 remediation types based on the number of actions taken) |
Accounts Created | Ultimate Sys Admin's Dashboard | Number of accounts that were added to PK Protect within the time range of the report |
Protected Accounts | Ultimate Sys Admin's Dashboard | Total number of accounts that exist in PK Protect |
VDIs Created | Ultimate Sys Admin's Dashboard | Number of devices with a type of ‘Window Desktop Virtual’ (Virtual Desktop Instance), added to PK Protect within the time range of the report. |
Protected VDIs | Ultimate Sys Admin's Dashboard | Total number of devices with a type of ‘Window Desktop Virtual’ (Virtual Desktop Instance), that exist in PK Protect |
Servers Created | Ultimate Sys Admin's Dashboard | Number of Windows or Linux servers that were added to PK Protect within the time range of the report |
Protected Servers | Ultimate Sys Admin's Dashboard | Total number of Windows or Linux servers that exist in PK Protect |
Endpoints Created | Ultimate Sys Admin's Dashboard | Number of Windows, macOS, iOS and Android devices that were added to PK Protect within the time range of the report |
Protected Endpoints | Ultimate Sys Admin's Dashboard | Total number of Windows, macOS, iOS and Android devices that exist in PK Protect |
Sensitive Emails | Email Dashboard | The number of emails sent that contained sensitive information (in the message or attachment); showing the total for each day, for the time range of the report |
Emails with Sensitive Message Bodies | Email Dashboard | The number of emails, whose message content was found to contain sensitive information, showing the total for each day, for the time range of the report |
Emails with Sensitive Subjects | Email Dashboard | The number of emails, whose subject content was found to contain sensitive information, showing the total for each day, for the time range of the report |
Emails with Sensitive Attachments | Email Dashboard | The number of emails, whose attachments that were found to contain sensitive information, showing the total for each day, for the time range of the report |
Sensitive Emails by Destination | Email Dashboard | The number of emails containing sensitive information (in messages or attachments), with a slice showing the number for each email recipient. (Top 10 recipients based on the number of emails sent to them) |
Emails with Sensitive Message Bodies by Pattern | Email Dashboard | The number of emails, whose message bodies that were found to contain sensitive information, with a slice showing each discovery pattern triggered. (Top 10 patterns based on the number of emails with message bodies containing sensitive information) |
Emails with Sensitive Subjects by Pattern | Email Dashboard | The number of emails, whose subject was found to contain sensitive information, with a slice showing each discovery pattern triggered. (Top 10 patterns based on the number of emails with subjects containing sensitive information) |
Emails with Sensitive Attachments by Pattern | Email Dashboard | The number of emails, whose attachments that were found to contain sensitive information, with a slice showing each discovery pattern triggered. (Top 10 patterns based on the number of emails with attachments containing sensitive information) |
Email Actions by Type | Email Dashboard | The number of emails (messages or attachments) that were remediated, with a slice showing the number for each type of remediation executed. (Top 10 remediation types based on the number of messages remediated) |
Manual Classifications | Classification Dashboard | The number of files that were manually classified, showing the total for each day, for the time range of the report |
Manual Classifications by Label | Classification Dashboard | The number of files that were manually classified, with a slice showing the total for each label. (Top 10 labels based on the number of classified files) |
Manual Classifications by Provider | Classification Dashboard | The number of manual classifications based on the method used to classify the file. The method is the application from which the label was applied, like Word, Excel or file classifier (Top 10 methods based on the number of classified files) |
Manual Classifications by User | Classification Dashboard | The number of files that were manually classified, with a slice showing the total for each user. (Top 10 users based on the number of files they classified) |
System Information | System Dashboard | Shows information about the SEM, including: Application URL, Application Version, Number of Database Connections, Database Version, Used and available disk space, Operation System version, Uptime of the SEM application and the time at which Daily Jobs are run. |
Active Devices | System Dashboard | The number of devices that synced with the PKWARE Enterprise Manager over the last 24 hours (current), the last week and the last month, based on the latest time in the time range of the report |
Agent Versions | System Dashboard | The number of different agent versions deployed, with a slice showing the number for each agent version found, based on the latest time in the time range of the report (Top 10 agent versions based on the number of devices with each version) |
Active Users | System Dashboard | The number of users that synced with the PKWARE Enterprise Manager over the last 24 hours (current), the last week and the last month, based on the latest time in the time range of the report |
Smartkeys | System Dashboard | The number of Smartkeys defined in the SEM (excluding personal Smartkeys and Community keys), based on the latest time in the time range of the report |
Community Keys | System Dashboard | The number of community keys defined in the SEM, based on the latest time in the time range of the report |
Archive Policies | System Dashboard | The number of archive policies defined in the SEM Policy tab, based on the latest time in the time range of the report |
Agent Updates | System Dashboard | The total number of times all the agents were updated, based on the latest time in the time range of the report |
Disk Space | System Dashboard | The amount of free and used disk space for the server on which the SEM is running, based on the time at which the report was run |
Labeled Files | MIP Dashboard | The number of files to which MIP labels were applied. Showing the total for each day; for the time range of the report |
Labeled Files by Name | MIP Dashboard | The number of MIP labeling actions executed, with a slice showing the total number of files for each specific MIP label. (Top 10 labels based on number of labeling events) |
Labeled Files by User | MIP Dashboard | The number of MIP labeled files, with a slice showing the total number applied for each unique user (Top 10 users based on number of MIP labeling events) |
Re-Labeled Files | MIP Dashboard | The number of files for which MIP labels were changed. Showing the total number of re-labeling actions for each day; for the time range of the report |
Re-Labeled Files by Name | MIP Dashboard | The number of files for which MIP labels were changed, with a slice showing the total number of files for each specific MIP re-labeling action. (Top 10 labels based on number of labeling events) |
Re-Labeled Files by User | MIP Dashboard | The number of MIP labeled files that were re-labeled, with a slice showing the total number of re-labeling actions for each unique user (Top 10 users based on number of MIP re-labeling events) |
Labels Removed | MIP Dashboard | The number of files MIP labeled files, where the labels were removed, such that they are now un-labeled. Showing the total for each day; for the time range of the report |
Label Removals by Name | MIP Dashboard | The number of MIP label removal actions executed, with a slice showing the total number of files where labels were removed, indicating the prior label name. (Top 10 based on number of label removal events) |
Label Removals by User | MIP Dashboard | The number of files where MIP labels were removed, with a slice showing the total number of MIP label removals for each unique user (Top 10 users based on number of MIP label removal events) |